Tuesday, March 22, 2016

How the Zika Virus is Affecting Spring Break Plans

Taylor Vander Wyst
Mrs. Straub
AP Economics - Insight
21 March 2016

How the Zika Virus is Affecting Spring Break Plans
People are anxiously waiting for spring break and packing their bags for a much needed vacation--however, they may want to consider unpacking their bags if they are traveling to a tropical location. Over the past couple months, the zika virus has been emerging in Mexico, Brazil, and the Caribbean. The Aedes mosquito species carries the zika virus which can cause harm to women and their babies (About). While growing in a mother who is infected with the zika virus, the baby can develop microcephaly which is a condition where the head is significantly smaller than the rest of their body. This can lead to many other birth defects as well (About).  Because of this risk, it has become difficult for people to decide whether or not to go on vacation because the trade offs are so extreme.
The zika virus is transmitted when someone gets bitten by the Aedes mosquito species. According to the Centers for Disease Control and Prevention, symptoms can include fever, rash, and joint pain. Since these symptoms are so minor, many people may not even know they contracted the virus--which is why it is so dangerous for women who plan to get pregnant. If someone takes the risk and travels to a country with the zika virus, some preventative measures to take are to wear long sleeve shirts and use bug repellant often. Hotel owners and managers have also been taking precautions by spraying more often to ensure that guests are safe (Mindock). Here is a map showing the countries that have been affected with the zika virus. The purple areas are where the virus has spread. Based on its proximity to the United States, it may not be long before the zika virus invades our borders.
Spring breakers are strongly advised to take precautions from the Center for Disease Control to determine if the risk is too great to travel. But canceling the vacation can be very costly since some resorts and airlines don’t offer refunds. Fortunately, airlines such as United Airlines, American Airlines, and JetBlue are offering refunds for women with doctors excuses (Vora). However, the other family members without a doctor’s excuse still have to pay. Jack Ezon, the president of the New York travel company Ovation Vacations, says that he “has had more than 50 cancellations for trips to the Caribbean and Mexico,” (Vora). If the zika virus continues to worsen, these numbers could increase. Since there are less vacationers willing to travel, the spending multiplier will decrease, thus resulting in less money circulating throughout these countries. Less people staying at resorts and hotels may also result in workers being laid off, leaving them frictionally unemployed. Then those unemployed laborers off will be in a job search. In St. Martin, 85% of the workers are employed by tourism directly or indirectly. They depend on tourists to make a living (Mindock). For poorer islands that make up the Caribbean, cash flow is essential to their GDP. In fact, tourism in Barbados makes up 36% of their GDP (Mandock). If more and more people avoid vacation destinations in the Caribbean, their GDP would significantly decrease which would negatively affect their economy.
Unless we can stop this problem and find a cure for the zika virus, increasing numbers of tourists might cancel their spring break trips for fear of the negative health effects for mothers and babies. For those who do not cancel their trips, extreme precautions must be taken to ensure that their spring break trips are safe.


Works Cited
“About Zika Virus Disease.” Centers for Disease Control and Prevention. Centers for Disease Control and Prevention, 22 Feb. 2016. Web. 20 Mar. 2016.
Mindock, Clark. “Will the Zika Virus Hurt Tourism in the Caribbean?” International Business Times. Ibt Media Inc., 27 Jan. 2016. Web. 20 Mar. 2016.

Vora, Shivani. “How the Zika Virus is Affecting Travel.” The New York Times. The New York Times, 28 Jan. 2016. Web. 20 Mar. 2016.

Economic Impacts Of March Madness

Zachary Corso
Mrs.Straub
AP Economics
Tuesday March 22nd
Economic Impacts Of March Madness
Its that time of year where everyone's turned their attention to the courts. Everyone fills out a bracket and hold tight that there final pick makes it all the way to the championship. Yea that right it's March Madness one of the best times of the year. For friends to fight over whose bracket is better.  According to Wallet Hub the chances of getting a perfect bracket is 1 in 9.2 quintillion yea that's right and that you have a better chance of winning back to back mega million lottery tickets than by filling out a perfect bracket.Yet the odds are unlike no other it still a massive economic booster for many of the hosting cities. And one of the best times to clench all of your attention towards the big screen and to see the underdog take home the win. Later on you will be able to grasp the economic impacts March Madness has, such as the profits TV gains, host cities, and overall productivity. All of these factors are major positive and negative impacts towards the economy.
First let's take a look at the real impact March Madness has on the economy. As there is an increase in demand for basketball fans to tune into watching March Madness. According to NCAA it is estimated that March Madness Live had reached all times records such as 80.7 million videos streamers. With the increase in demand that leaves March Madness live with “...17% over last year”(NCAA). Which as showed a rightward shift in the demand curve because of the increase of viewers.
Now one might wonder what this increase of demand for March Madness posses such as the profits gained from TV, as well as restaurants, and host cities. It was estimated that the “average 30 second ad sold for $1.5 million”(Ogus). Which will bring in a total revenue of $1.1 billion. Yet the price is high for companies they have to look at the opportunity cost in which tv companies need to take a look at each side by taking a look at the benefits in which option is better. They have to take a look and see if the higher price is really worth it. By taking a look at the increase in viewers for such a popular event as well as the return rate. And that the host city of the final 4 games which is Houston this year gains $300 million dollars. Witch is is not counting in all of the other restaurants all over the world that supply that kind of atmosphere that everyone loves.
But while taking a look at the positive factors that March Madness has towards the economy it also brings in negative factors. Such as there is a decrease in productivity as according to Wallet Hub there is an estimated $1.9 billion loss due to the fact that there are unprotected workers. Because they are constantly checking their brackets as well as cheering for their favorite team. Which could then pose an negative externality because if one is cheering for a team other workers could then get distracted which could result in decreasing their productivity.
Yet productivity might be a big negative factor that stands within March Madness it's has more positive factors such as it boosts social activity at work and with friends by trying to get that next perfect bracket, brings in $1.1 billion in tv ads, projected impacts on final 4 host city 300 million, and the major impacts that it has on restaurants such as an 19% increase in pizza sales.
Works Cited
Kiernan, John S. "2016’s March Madness By The Numbers." Wallet Hub. Evolution Finance. Web. 20 Mar. 2016.
Ogus, Simon. "The Economic Impact Of March Madness From First Four To Final Four." Forbes. Forbes Magazine, 17 Mar. 2016. Web. 21 Mar. 2016.
Schwartz, Nick. "Duke Math Professor Says Odds of a Perfect Bracket Are One in 2.4 Trillion." For The Win. 17 Mar. 2015. Web. 21 Mar. 2016.

Monday, March 21, 2016

Economics of Spring Break

Kayla Holzhauer
Mrs. Straub
AP Economics
22 March 2016

Economics of Spring Break


After 4 months of snow shoveling, ice scraping, parka wearing and Netflix watching, the majority of us are ready to pack our bags and leave Wisconsin. When spring break rolls around in March or April an overwhelming number of us have already booked flights with warm weather on our minds. During the weeks of spring break many of us will leave our homes in search of a warmer climate, travelling everywhere from New York, to Myrtle Beach, to Cancun, to the Florida Keys. While the majority of us consider spring break to be little more than a holiday, it is the economic force for many seasonal businesses and a vital player in the macroeconomy.
So, just how big is spring break? Police Chief Drew Whitman of Panama City Beach, Florida estimates that the city’s population increases from about 12,000 to up to 250,000 during the spring break months of March and April (“Spring”). This is an overwhelmingly huge number of travellers, but the money generated is what really matters to the businesses of the popular spring break destinations. During spring break, “stores, hotels and restaurants in Panama City Beach saw over $170 million in economic benefit” (“Sea”). However, although these numbers appear great on paper, they don’t come without an opportunity cost.
The most obvious inconvenience to residents of vacation destinations is the overcrowding of beaches, hotels and restaurants created by travellers. The overcrowding also leads to other problems such as littering and pollution. The large amounts of excessive drinking often lead to minor crimes, accidents and arrests. In order to deal with these problems, the cities have to plan for cleanup costs and increased safety precautions. Of course, the costs barely create a dent in the benefits as “the spring break season accounts for 30 to 35 percent of some local businesses’ yearly income” (“Spring”).
The smaller economic benefits on local businesses are basic and obvious; but, when looking further into the economics of the spring break holiday, vacation spending is a significant player in the macroeconomy. Breaking it down, people generally save up their money for bigger vacations. After months of spending they are willing to splurge on their vacations, on everything from a beach condo to a new bathing suit and pre-vacation tan. This money that is moved from the consumer’s savings account back into the economy has an increasing impact via the spending multiplier. The tourist spending creates a flow of money that drives the economy. Furthermore, the nature of spring break can be used as a tool to determine how the economy is doing. In bad economic times less people are likely to splurge on extravagant vacations, especially college students. “If students are going on Spring Break and spending money that is a qualitative indicator that the economy is doing well” (Yakabe).
It is clear that the economy would fall behind without the push of Spring Break; and, while many of us prefer to view Spring Break as a chance to get away from real life, our search for paradise has significant real world application.
"Sea, Sun, Sand... and Revenue." Msnbc.com. 2004. Web. 21 Mar. 2016. <http://www.nbcnews.com/id/4428577/ns/business-us_business/t/sea-sun-sand-revenue/#.VvCVHFQrJdg>.  
"Spring Break! How Cities Prepare for an Increase in Tourists." Spring Break! How Cities Prepare for an Increase in Tourists. Web. 21 Mar. 2016. <http://www.governing.com/blogs/view/spring-break-how-cities-prepare-increase-tourists.html>.
Yakabe, Selena. "Spring Break Spending Boosts Economy." Sdsucollegian.com. The Collegian, 4 Mar. 2016. Web. 21 Mar. 2016. <http://www.sdsucollegian.com/news/article_0221f9a4-e08a-11e5-aea6-0752133eed07.html>.


Friday, March 18, 2016

Economic Generational Differences

Sarah Kaderavek
Mrs. Straub
AP Economics
17 March 2016
Economic Generational Differences
With growing generational diversity in today’s workforce, employees who hold similar positions and salaries to one another may not exhibit similar consumer behaviors as expected. This being so when examining a workplace, one will find Traditionalists, Baby Boomers, Generation X-ers, Millennials and eventually the up in coming Gen. 2020 (see Figure 1). Each generations have unique characteristics that impact how they act. These characteristics, as well as the state of the economy, translate to their likeliness to spend or save their additional income. In other words, although taxes and the economy dictate consumer’s marginal propensity to consume (MPC) and marginal propensity to save (MPS), generational differences also have a large influence in this same matter.
Figure 1. Breakdown of the workplace by generation
Traditionalists are the oldest generation found in the workplace. This generation was born between 1900 and 1945 and highly influenced by The Great Depression and World War II (West). The downturn of the economy during The Great Depression started with the collapse of the stock market and the failure of banks in the United States. The failure of banks lead to many bank runs which only worsened the issues faced by the economy. If you’re interested in learning more about this watch this video. These occurrences caused much of this generation to grow up poorer, therefore instilling the importance of saving in this generation. Additionally, because they grew up with less, this generation is comfortable living with less. Because of these values, their MPS is much higher than other generations while their MPC is often much lower.
Baby Boomers are the second oldest generation found in the workplace. This generation was born between 1946 and 1964 (West). Seeing as this generation is post Great Depression and post war, they had a very different life than the Traditionalists before them. According to Gelinda Grimes article, the Baby Boom generation was the first generation for a majority of its population to seek higher level education. Additionally, this is the generation of optimism due to the economic upturn after the war and the social changes that followed. These experiences not only create a sense of hard-work among Baby Boomers but also a sense of materialism (West). Due to this, Baby Boomers are more likely to have a higher MPC than the generation before them, while still remaining fiscally responsible. Generations X-ers are the generation that came after the Baby Boom, being born between 1965 and 1980 (West). Seeing as they were raised by Baby Boomers, this generation was taught to value their own opinion and work hard. This is also the smallest generation in size, so many other traits are shared with the generation before them. But according to Devon Scheef, this generation has “traits of independence, resilience, and adaptability.” Either way, their MPC and MPS can be predicted to be quite similar to Baby Boomers.
Millennials are the most current generation of adults seen in the workforce. This generation was born between 1981 and 2000 (West). When compared to Generation X, this generation “works to live” rather than “lives to work.” This generation has helped develop the greater demand  for technology as well. Thus, they are generally less stingy with money, so long as their career allows them to be. However, because their parents from Generation X pursued higher education, and they did as well, parents from this generation are interested in investing in their children’s futures. Due to these factors, it can be argued that their MPC and MPS are almost equal but may fluctuate due to certain expenses.
In conclusion, there is far more that goes into determining how an individual will spend there money than just the current state of the economy or tax and interest rates. Overall, as the generations have developed people are willing to spend more money as seen by the mindset of the Millennial versus the mindset of a Generation X-er. While marginal propensity to consume and marginal propensity to save fluctuate, there is a greater psychological understanding of each consumer which can be examined.
Works Cited
Grimes, Gelinda. “How the Baby Boom Generation Works.” HowStuffWorks. Infospace LLC.,
2016. Web. 12 March 2016.
Kadlec, Dan. “Millenials Won’t Cut Spending But Expect to Save More.” Time Inc. Time Inc.,
2016. Web. 12 March 2016.
West Midland Family Center. Generational Differences Chart. PDF file.
Scheef, Devon. “Generation X and The Millennials: What You Need to Know.” Law Practice

Management. American Bar Association, 2005. Web. 12 March 2016.

Thursday, March 17, 2016

Spring Break

Alyssa Czerwinski
Mr. Reuter
Economics
29 February 2016
Spring Break
Spring break is an excuse used by many college students to leave their universities for a week and escape to a warmer area. These students dish out hundreds if not thousands of dollars going to to popular areas such as Cancun, Mexico, or Destin, FL. Even though there is opportunity cost in whether to stay home or to leave, with the idea of having fun on their minds, students do not realize how much their vacation have effect on revenue on local and national economies.
Since “ 1934, Sam Ingram, a Colgate College swim coach, was looking for a warm place to keep his swimmers in shape. He chose the small, quiet town of Ft. Lauderdale, Florida. More swimming instructors followed.” (Thompson). Little did Ingram know that his movement to help his swimmers would be the reason for students spends a total of billions of dollars every year to travel during spring break. Florida and Texas alone receive about 1 billion dollars in revenue every spring break.
There are many expenses when it comes to traveling, such as a plane ride, or gas for a car, food, hotel room expenses, passports, clothing and many more. Most of these costs contribute to the national income. Many spring break destinations have a small population prior to spring break, then drastically increasing as more consumers come to their city. As more people come, it can help small businesses stay afloat as well as help their state/county income.
While many think of spring break as a time to get away from classes, it is so much more. Spring break is a positive trip if the person stays in the U.S. and overall helps our income as a whole. Remember that while on your spring break vacation this year.


Thompson, Derek. "2,000 Years of Partying: The Brief History and Economics of Spring Break." The Atlantic. Atlantic Media Company, 26 Mar. 2013. Web. 13 Mar. 2016.

The Hideaway for Music Lovers

Claire Ellington
Economics B2
Reuter
3/13/2016
The Hideaway For Music-Lovers
Nashville, Tennessee, better known as Music City U.S.A., has consistently increased in population for the past century, however in the past 10 years, the population has rapidly increased with every coming day. What attracts individuals in particular is the abundance of job opportunities and growing love for the lively culture. Outpacing the rate of population growth in Nashville is the job growth rate. Not only is the city a notably desirable destination for aspiring musicians, but over 600 jobs will soon open in the Ryder Supply Chain Solutions, over 200 jobs in Servpro industries, as well as additional jobs in hospital chains and Community Health Systems. And although job opportunities open up and the unemployment rate decreases, people across the country are becoming more aware of the entertaining, Music City vibe of downtown Nashville as well, causing a greater desire to develop a life in the area. As seen in the graph below, both population and nonfarm employment show an increase over time, however the job production increased a whole 10% more than population growth.

The influx of people in the community, caused by job growth and an increased desire to live in Music City, alters the demand for housing by the demand determinants: population, income, and consumer taste. As the population increases, the demand for housing increases reflected by real estate market trends’ increase of 11%, or an approximate $21,745. Many homes owned by Nashville natives foreclosed due to the owner’s inability to keep up with the rapidly increasing mortgage payments. Although small town natives have to adapt to developments which may not benefit them, Nashville’s economy continues to boost by this urbanization. Below reads a graph of the increasing prices of properties over the dates August 2011 through October 2015.

The income aspect affects those who live in Nashville and those who aspire to live there since the scene now fills with newer jobs with higher incomes, therefore more people are willing to pay higher prices for homes that used to sell for lower prices. Most importantly, as previously mentioned, Nashville contains a vibrant environment for all kinds of music lovers that attracts a wide range of people, young and old, due to the increased consumer taste in live music.
 
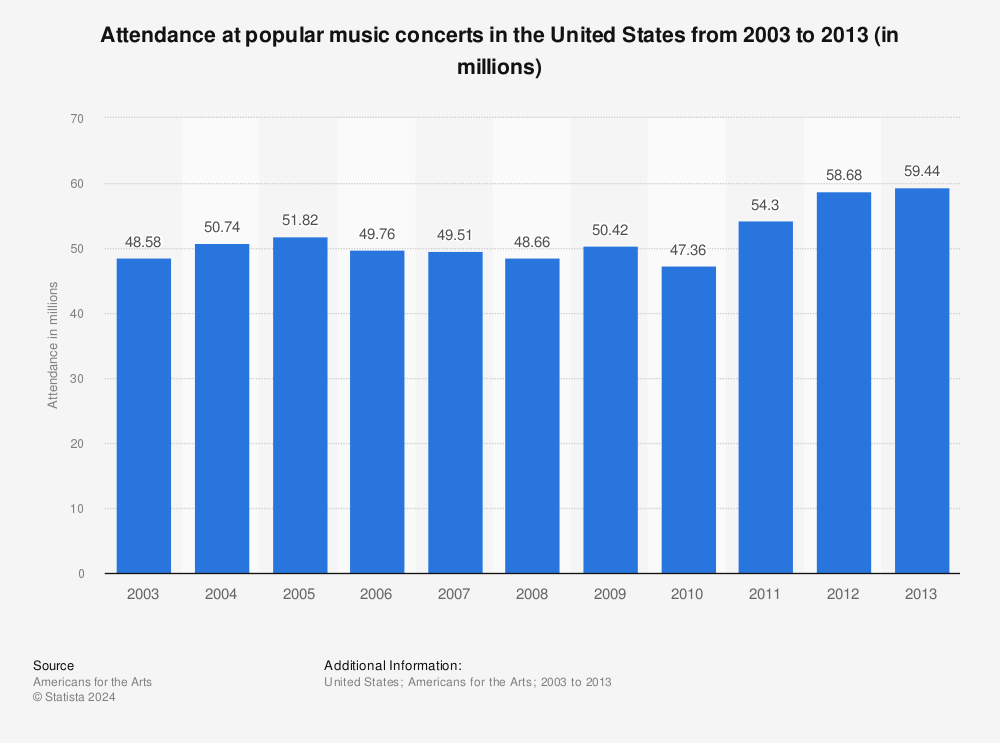
As seen in the graph above, the United States has continually increased sales for live music tickets and sponsorship of which Nashville provides a major role in. Every turn, every coffee shop, and every restaurant is filled with some genre of live music in Music City. The plentiful scenes of live music provides yet another reason for citizens all over the U.S. to move to the area, whether they are artists themselves or simply enjoy listening to the strums of a singer/songwriter’s guitar.
Of the many up and coming cities, Nashville, Tennessee is one of the top in recent growth. The city has a variety of offerings for the public like job opportunities, much desired live music performances around every corner, and more. However, these many opportunities come at a cost: the opportunity cost. While people love to witness a city grow in popularity and urbanize, the natives of the city have to watch the cost of their house mortgages and daily purchases quickly rise. But despite the rising prices of standard living, Music City U.S.A. has become one of the newest hot places to live, attracting people from across the country, and even the world.
Works Cited
Lindeman, Nicholas. "Growth Trends & Forecasts." Nashville Area MPO:. Nashville Area MPO. Web. 13 Mar. 2016. <http://www.nashvillempo.org/growth/>.
"Real Estate Data for Nashville." Real Estate Market Trends for Nashville, TN. Trulia. Web. 13 Mar. 2016. <http://www.trulia.com/real_estate/Nashville-Tennessee/market-trends/>.
"Live Music Industry Revenue in the United States from 2010 to 2019, by Source (in Billion U.S. Dollars)." Statista: The Statistics Portal. Statista. Web. 13 Mar. 2016. <http://www.statista.com/statistics/491896/live-music-industry-revenue-in-the-us-by-source/>.
Ward, Getahn. "Can Nashville's Growth Continue?" The Tennessean. Web. 13 Mar. 2016. <http://www.tennessean.com/story/money/real-estate/2015/08/14/population-gains-key-nashville-job-growth/31509555/>.
MLA formatting by BibMe.org.
Related Posts Plugin for WordPress, Blogger...